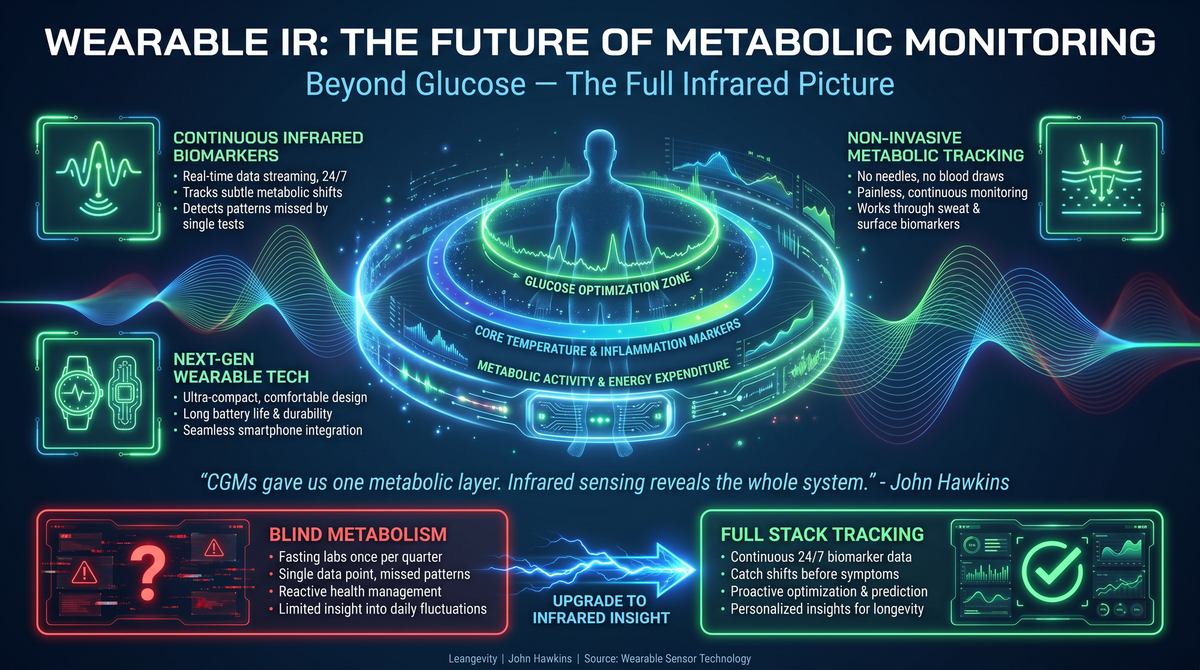
Wearable IR: The Future of Continuous Metabolic Monitoring
Continuous glucose monitors changed the game. Next-gen wearable IR sensors could monitor metabolic health in real-time, revealing what blood tests miss.
Your Apple Watch Knows You're Insulin Resistant. Here's What It's Trying to Tell You.
Here's what's actually happening metabolically with a lot of people I talk to.
They get their labs back. Fasting glucose: 92 mg/dL. A1c: 5.4%. Everything in range.
But over the past two years, their resting heart rate has crept from 58 to 66. Their HRV has dropped from 55ms to 38ms. They're walking 2,000 fewer steps on weekdays than they used to.
That's not stress. That's not "just getting older."
That is your cardiovascular system — and your wearable — flagging insulin resistance years before your fasting glucose looks abnormal.
Most people find out 10-15 years too late.
The WEAR-ME Study: What Just Changed
In February 2026, Nature published a study called WEAR-ME (Vol. 652, pp. 451-461). It took 1,165 people with a median BMI of 28 and median age of 45 — that's the exact demographic I work with every day — and asked a straightforward question: can consumer wearables combined with a few routine blood markers detect insulin resistance more accurately than blood work alone?
The answer was yes. And the margin was meaningful.
Wearable data + blood biomarkers: AUROC 0.88 Blood biomarkers alone: AUROC 0.76
That's a 16% improvement in detection accuracy by adding what your Apple Watch or Fitbit already knows about you.
But here's the finding that actually keeps me up at night:
20% of the participants with completely normal glucose levels had insulin resistance.
Their labs looked fine. Their bodies were already in trouble.
How the Study Worked
The WEAR-ME model wasn't trained on guesswork. The researchers built a deep neural network using a Wearable Foundation Model pretrained on 40 million hours of sensor data from Fitbit and Google Pixel devices. They then validated it against HOMA-IR — the gold-standard measurement of insulin resistance — in a real-world clinical population.
The model learned to read metabolic signals from:
- Resting heart rate
- Heart rate variability (HRV)
- Daily step count
- Sleep architecture
Combined with three routine blood markers — fasting glucose, triglycerides, and HDL — the model dramatically outperformed blood work alone.
The SHAP analysis (which tells you which features matter most) confirmed something I tell clients every week:
Fasting glucose (r=0.57) and BMI (r=0.43) are the dominant signals. No surprise. But resting heart rate (r=0.27) and step count (r=-0.25) are meaningful independent contributors. HRV (r=-0.14) adds additional signal.
Translation: your wearable is giving you a real-time metabolic readout. Not a guess. Not a fitness trend. Actual physiological data that correlates with how insulin-sensitive you are.
The 20% Paradox: Why Normal Labs Don't Mean You're Fine
Here's what most people get wrong about insulin resistance.
They think: "My fasting glucose is 95. I'm fine."
Not quite.
Insulin resistance develops silently for 10-15 years before it tips over into elevated fasting glucose or an A1c in the pre-diabetic range. During that silent window, your pancreas is working harder and harder to produce more insulin to keep your blood sugar in the normal range. Your cells are becoming progressively more resistant. Your visceral fat is accumulating. Your inflammatory markers are creeping up.
By the time your fasting glucose crosses 100 mg/dL — the standard threshold — you've already lost a decade of intervention time.
The WEAR-ME study found this window is now detectable. Not through invasive testing. Through the sensor data your body generates every day.
What Elevated Resting Heart Rate Actually Means Metabolically
The WEAR-ME study showed that resting heart rate is a real, measurable metabolic signal — not noise.
The mechanism is clinically coherent:
1. Insulin resistance drives sympathetic nervous system activation, which elevates resting heart rate 2. Compensatory hyperinsulinemia promotes sodium retention and endothelial dysfunction, increasing cardiac load 3. Visceral adiposity and chronic low-grade inflammation further stress the cardiovascular system 4. HRV drops as the autonomic nervous system shifts toward sympathetic dominance
When your wearable shows an elevated resting heart rate and a declining HRV trend — in the absence of new training stress, illness, or medication — that is a metabolic signal. The WEAR-ME model quantified it as a meaningful independent contributor to insulin resistance prediction (r=0.27).
Most people see the elevated RHR and think: I'm not sleeping well or I'm more stressed than usual.
Sometimes that's true. But sometimes it's your body trying to tell you something more specific.
What You Can Do With This
The WEAR-ME study is evidence that wearable data can serve as an early warning system for metabolic dysfunction. That doesn't mean your Apple Watch is a diagnostic tool. It does mean you have more data than your doctor is looking at.
Here's the practical sequence:
1. Look at the trend, not the snapshot. One elevated RHR reading means nothing. Six months of gradually rising RHR and falling HRV — in the context of normal weight or mild overweight, age 35-60 — is a pattern worth investigating.
2. Run a full metabolic panel. Fasting glucose and A1c are not enough. Ask your provider for: fasting insulin, HOMA-IR, fasting triglycerides, HDL, and LDL particle size. The WEAR-ME model used fasting glucose, triglycerides, and HDL as its blood markers — not because they're the only relevant markers, but because they're available, affordable, and interpretable.
3. Consider continuous glucose monitoring. This is where Leangevity comes in. CGM gives you 14-day glucose profiles that reveal post-meal spikes, overnight patterns, and glucose variability — none of which show up in a single fasting lab draw. Combined with your wearable data, CGM creates the WEAR-ME-like picture: a continuous, multi-signal readout of your metabolic state.
4. Work with someone who reads the whole picture. Standard care is built to treat disease that's already diagnosable. Metabolic coaching is built to identify dysfunction before the disease label applies. If your labs are "normal" but your wearables are telling a different story — that gap is exactly where coaching is most valuable.
Why the AUROC 0.88 vs. 0.76 Gap Matters
AUROC stands for Area Under the Receiver Operating Characteristic Curve. It's a measure of how well a test distinguishes true cases from false positives across all thresholds.
An AUROC of 0.88 means the WEAR-ME model is very good at distinguishing insulin-resistant individuals from metabolically healthy ones. An AUROC of 0.76 is decent but leaves significant room for false negatives — meaning people with insulin resistance who get missed.
The 0.12 difference between the two models doesn't sound dramatic until you remember what "missed insulin resistance" actually means in practice: years of disease progression, accumulated visceral fat, inflammatory load, and lost intervention time — before a single lab flag goes up.
Wearables aren't replacing clinical care. They're giving you more signal to act on before the standard care system catches up.
The Bottom Line
Your wearable is not a toy. It's a metabolic sensor that your doctor is not looking at.
The WEAR-ME study — Nature, 2026, 1,165 participants, AUROC 0.88 — shows that resting heart rate, HRV, step count, and sleep architecture contain real information about your insulin sensitivity. Information that's independent of what your fasting glucose says.
20% of people with normal glucose levels have hidden insulin resistance. You may be one of them.
The intervention window for reversing insulin resistance — through dietary modification, resistance training, strategic fasting, and sleep optimization — is widest when the condition is caught early.
If your wearables are showing a pattern, don't wait for your labs to confirm it. The WEAR-ME data suggests you'll be waiting 10-15 years too long.
CTA: Ready to see what your wearable data and glucose patterns are actually telling you? Leangevity offers metabolic screening with CGM for clients ready to work with a coach who reads the whole picture — labs, wearables, and patterns.
👉 Book your discovery call: [link]
Leangevity provides metabolic health coaching, not medical treatment. This content is for educational purposes only. It is not a substitute for professional medical advice, diagnosis, or treatment. Always consult your healthcare provider before making changes to your health regimen.
Sources
- WEAR-ME Study. Nature. Vol. 652, 2026, pp. 451-461. doi: 10.1038/s41586-026-10179-2
- SHAP feature importance data: fasting glucose (r=0.57), BMI (r=0.43), triglycerides (r=0.40), resting HR (r=0.27), step count (r=-0.25), HRV (r=-0.14)
- Ground truth: HOMA-IR measurements
- Model: Wearable Foundation Model, 40M hours pretrained sensor data (Fitbit/Pixel)